Financial data from more than 2,000 U.S. integrators reveals the habits, metrics, and disciplines that separate high-performing firms from those quietly leaking profit.
Growth without financial leadership is just chaos with better branding. The difference between commercial integrators that scale and those that stall comes down to whether leaders measure what matters … and then act on it.
Using NSCA’s Financial Leadership 101 for Systems Integrators white paper as a guide, D-Tools analyzed real performance data from more than 2,000 U.S. commercial AV integrators that use its D-Tools Cloud software. That data was then used to develop the D-Tools Industry Benchmark Guide, which looks at many of the 26 key metrics identified by NSCA in its Financial Leadership 101 document.
The numbers inside confirm what seasoned operators already know, while exposing where many firms are quietly leaking profits. Let’s take a closer look.
Pipeline Is a Leading Indicator
According to the data, the median integrator generates two proposals per month. That may sound modest, but volume alone does not equal health.
The mean (average) is nearly double that, which tells us something important: Some firms are aggressively churning out quotes, while the majority are more selective.
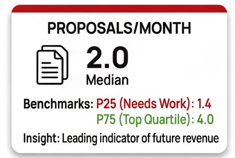
Proposal volume only works if it converts. A bloated pipeline with poor qualification is overhead in disguise.
The firms that win consistently are not quoting everything that moves; they’re quoting the right opportunities.
Close Rate Reveals Sales Discipline
Across the industry, the median close rate is 69.7%. But the close rate statistic highlights the importance of accurate reporting.
Often, dealers create a proposal in their software, then print out the proposal as a document and present it in person to the customer. Unfortunately, many of those integrators don’t “close the loop” by indicating in the software that a proposal has been won (or lost).
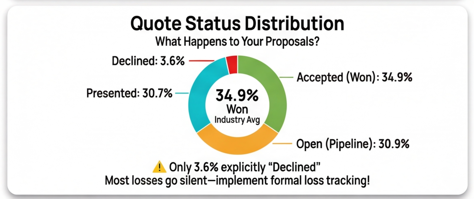
Indeed, 30.9% of proposals in D-Tools Cloud remain “open” with no resolution, while just 3.6% of quotes are marked as “declined.” If unresolved proposals are included in the cumulative data, the percentage of proposals in D-Tools Cloud that are “won” shows as just 36% … a glaringly low rate compared to the 69% success rate.
High win rates come from:
- Discipline
- Clear qualification criteria
- Repeatable sales processes
- Courage to walk away from deals that don’t fit
So, while many integrators continue to use their business management software for scheduling, product procurement, project management, and more, they’re limiting their ability to produce fully accurate reports on the state of their business by not indicating the success or failure of their quotes. Most losses fade into silence.
If you aren’t tracking why you lose, you’re guessing about how to improve.
Deal Size Separates Capacity from Capability
In D-Tools Cloud, the median individual signed contract size is just over $9,000, while the average exceeds $19,000. That gap exists because large commercial projects skew the average upward.
Chasing bigger deals changes your business model whether you plan for it or not. Larger projects demand stronger project management, tighter labor controls, and better cost forecasting.
Note: Individual contract size does not necessarily reflect the size of the entire project. Many integrators break up a single project into multiple contracts based on system, room, or phase.
Material Margin Is the First Line of Defense
Median material margin lands at 41.2%; top-performing integration companies push past 47%. Firms below the 33% threshold operate in dangerous territory, often competing on price alone. Once material margin erodes, labor has to work miracles just to break even.
NSCA has long warned against margin giveaways, and the data backs it up. The most profitable firms are not the cheapest. They sell value, protect scope, and understand their pricing floor.
Discounting may win deals, but it rarely builds durable businesses.
Net Gross Margin Is Where Leaders Separate Themselves
NSCA’s recommended target of 40% net gross margin is achievable; the industry average comes in at 41.9%. More than half of all integrators (57.5%) meet or exceed this benchmark, but nearly one in five operates below 30%, leaving little room for error when projects go sideways.
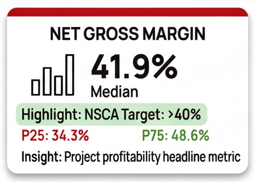
Net gross margin is the metric that absorbs mistakes: bad estimates, scope creep and labor overruns. Without a healthy margin buffer, one problem job can erase a quarter’s worth of progress.
Labor Mix Tells You What Business You’re Really In
The median labor mix sits at 23.8%, meaning that less than one-fourth of sales revenue in signed contracts is derived from labor, while more than three-quarters of the money comes from equipment sales. Most integrators’ labor percentage falls between 17% and 31%. That range reflects different business models, not right or wrong answers.
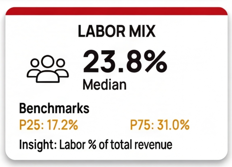
Low labor mix can signal missed revenue or untracked costs. High labor mix may indicate service-heavy offerings or labor-intensive projects. Either way, if you can’t predict and price your labor accurately, profitability becomes a coin toss.
Management Is Key
Across every metric, the same pattern emerges. Top performers track consistently, review monthly, and adjust early before problems become crises. The integrators that win long-term treat metrics as tools. They know their numbers. With its Financial Leadership 101 guide, NSCA has given the industry the framework; D-Tools provides the data to better understand how the industry is doing with these key metrics and KPIs.
D-Tools and NSCA talked at length about this data in a recent webinar. NSCA members can listen to the webinar on-demand at any time to:
- See what top performers do differently
- Identify where laggards fall short
- See how their own businesses stack up
D-Tools is an NSCA Business Accelerator.