For years, conversations about commercial integration revenue have defaulted to a familiar shorthand: AV pays the bills, and everything else is “nice to have.”
But a fresh look at D-Tools Cloud data, which covers won contracts during the first half of 2026, suggests a different conversation.
A Broader Revenue Model Is Taking Shape
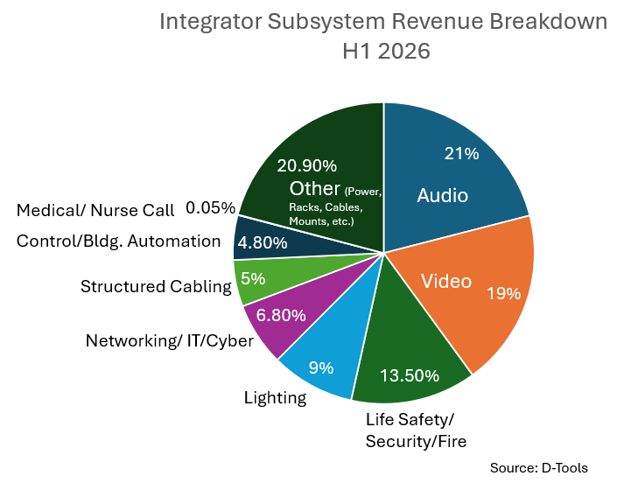
Audio and video remain the largest individual categories when it comes to revenue share, but not by the margin many assume.
- Audio accounts for 21% of total product revenue
- Video accounts for 19% of total product revenue
With a combined 40%, they’re still the leader, but they’re no longer the combined majority. The other 60% of integration revenue is spread across seven additional categories:
- Security and life safety (12.9%)
- Lighting (9%)
- Networking, IT, and cybersecurity (6.8%)
- Structured cabling (5%)
- Control and building automation (4.8%)
- Fire systems (0.5%)
- Other (20.9%), including infrastructure equipment like power, mounts, cable, electrical, racks, and more
Commercial integrators today are running multi-category businesses, whether they set out to do so or not.
It’s important to note that this insight doesn’t result from a handful of large, unusual firms that are skewing the average. Of the integrators represented in the data tracked over the trailing year:
- 99.5% installed at least one of the nine major subsystems
- 84.1% installed four or more of the nine major subsystems
- Only 5.8% operated as single-category specialists
Where Is System Growth Happening?
The more interesting story may be found in the growth numbers. Comparing the first half of 2026 to the second half of 2025, lighting posted growth of 50.1%—easily the fastest of any category with meaningful scale. Security and life safety wasn’t far behind at 33.9%; even audio (hardly a young category) grew a healthy 29.8% over the same period.
By contrast, video didn’t crack the list of top-growth categories, signaling that the long-reigning king of integration revenue may be ceding ground, at least in growth terms, to categories once considered secondary.
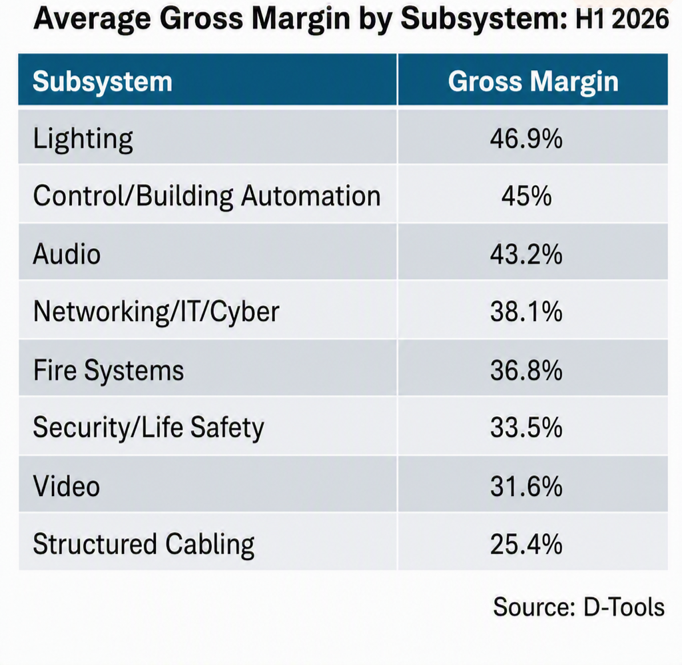
Gross margin data adds another layer worth integrators’ attention. Lighting is the fastest-growing category and carries the highest average gross margin, at 46.9%. That puts it ahead of control and building automation (45%) and audio (43.2%).
Video, despite its size, sits near the bottom at 31.6%, only modestly ahead of structured cabling (25.4%). Security and life safety lands in the middle at 33.5%, with networking at 38.1% and fire systems at 36.8%.
Taken together, these numbers point to a channel in transition.
The categories that built the industry—audio and video—still generate the largest share of revenue, and audio in particular continues to combine solid growth with strong margin.
But video’s combination of high revenue share and comparatively low margin should prompt integrators to ask whether it’s still pulling its weight on the bottom line.
Meanwhile, lighting and security are emerging as the categories worth building real capability in: Both are growing faster than the market, and lighting in particular pairs that growth with the best margin profile of any category measured.
For integration firm owners, the practical takeaway is to recognize that business has already diversified around them. With 84.1% of active integrators now installing four or more subsystems, the question owners need to be asking is: Are the categories being added the ones with the best growth and margin characteristics?
On both counts, the data points toward lighting and security as the categories to watch.
Editor’s Note: The topline metrics referenced in this article are drawn from the D-Tools 2025 Year-in-Review Report, which analyzes proposal and signed-contract data from D-Tools Cloud users across both residential and commercial integration markets. The methodology differs from NSCA’s Financial Analysis of the Industry (FAI) report, which is based on contractor financial statements and broader cost-of-doing-business accounting practices. In particular, labor burdening and cost allocation methodologies may vary among D-Tools users, which can impact reported gross margin figures. As a result, certain metrics—especially gross margin—may not align directly with NSCA benchmarking data and should not be viewed as apples-to-apples comparisons.